


Introduction
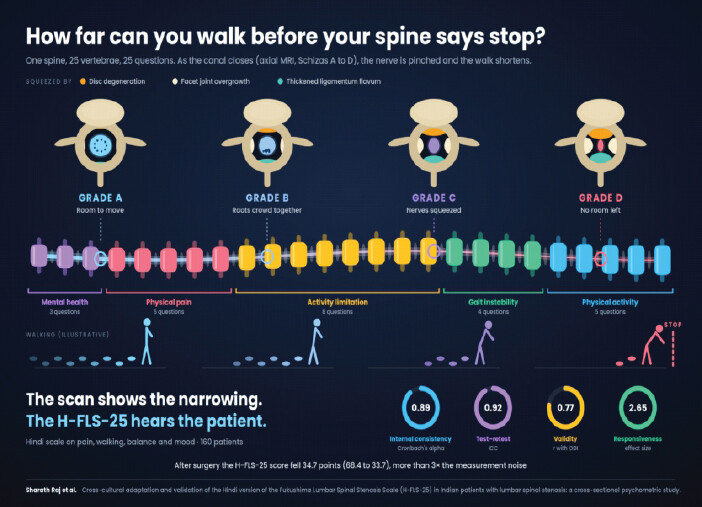
Narrowing of the spinal canal, lateral recess, or neural foramina defines lumbar spinal stenosis (LSS), most commonly the end result of disc degeneration, hypertrophic facet joints, and a thickened ligamentum flavum. The hallmark clinical picture is neurogenic claudication together with low back pain and lower-limb symptoms that intensify with standing or walking and ease when the spine is flexed forward or at rest. Estimates of how common LSS is differ considerably depending on the diagnostic threshold used and the clinical setting studied, ranging from roughly 11% in community samples to over one-third of patients presenting to combined primary and secondary care [1]. Dedicated population data from India remain sparse, though computed tomography-based imaging series from Indian tertiary centers have reported considerable canal narrowing across spinal levels [2], and Indian orthopedic professional bodies have identified spinal disease as an increasingly important contributor to musculoskeletal disability in the country’s aging population [3].
Clinicians commonly rely on non-disease-specific tools, among them the Oswestry Disability Index (ODI), the Visual Analog Scale (VAS), and the Short Form-36, to quantify LSS-related disability, and Asian-language versions of the ODI, including a Korean translation, have already undergone formal validation [4]. None of these tools, however, was built around the particular symptom profile of LSS, especially the posture-dependent nature of neurogenic claudication. The Zurich Claudication Questionnaire goes some way toward filling this niche, although a Korean validation effort noted that it carries cultural limitations when used outside its original population [5]. Sekiguchi and colleagues in Japan developed the Fukushima LSS scale (FLS)-25 precisely to capture the physical, activity, and psychological dimensions of LSS in one self-administered tool [6,7,8], and later work confirmed its ability to detect treatment-related change [8]. Cross-cultural adaptations of the FLS-25 now exist for Iran [9], Korea [10], and China [11], each reporting acceptable reliability and validity.
Given how widely LSS affects patients in India and how many people across North India speak Hindi as a first or working language, the absence of a Hindi disease-specific patient-reported outcome measure for LSS is a notable gap; clinicians and investigators have had to make do with generic instruments that may miss much of what patients with LSS actually experience. This study set out to build a Hindi adaptation of the FLS-25 (H-FLS-25) through a formal cross-cultural adaptation process and to examine its reliability, construct and known-groups validity, factor structure, and sensitivity to surgical treatment in a heterogeneous cohort of Indian patients with symptomatic, radiologically confirmed LSS.
Materials and Methods
Ethics statement
This study was approved by the Institutional Ethics Committee (Ethics Code: DRB/Ortho/2025/68). Approval was obtained before enrollment began, and every participant provided written informed consent prior to taking part. The study was conducted in accordance with the principles of the Declaration of Helsinki.
Study design and setting
We carried out this cross-sectional psychometric validation study in the Department of Orthopaedics at a large tertiary referral institute in North India offering comprehensive spinal services between June 2025 and April 2026. This institute is among the largest tertiary referral institutions in the country and serves a catchment of approximately nine to ten Indian states, so that its patient population encompasses a wide spectrum of clinical presentations and of socioeconomic, educational, and regional backgrounds.
Participants
We enrolled 160 consecutive Hindi-speaking patients with a diagnosis of symptomatic LSS. To qualify, patients had to be older than 40 years; report neurogenic claudication and/or radiating lower-limb pain or numbness for at least 3 months; have LSS confirmed radiologically on lumbar spine magnetic resonance imaging and graded using the Schizas morphological classification [12]; and be able to read and understand Hindi well enough to complete a self-administered questionnaire on their own. This requirement reflects the design of the FLS-25 as a self-administered instrument so that its properties were examined in the format for which it was developed. Enrollment of consecutive patients, without selection on the basis of severity, comorbidity, or pattern of disease, was intended to limit selection bias, and patients with mild-to-moderate as well as severe stenosis, with central as well as foraminal disease, and with or without spondylolisthesis were included (Table 1). We excluded anyone with prior lumbar spine surgery, coexisting myelopathy or peripheral neuropathy, walking limitation driven mainly by hip or knee osteoarthritis, uncontrolled psychiatric or cognitive impairment that would compromise reliable self-report, or unwillingness to consent. Fifty-four patients in the cohort were evaluated while still awaiting surgery (the pre-operative subgroup), and 106 had already had surgery at least 3 months earlier (the post-operative subgroup); a further 48 patients, drawn from across both groups, completed assessments both before surgery and 3 months afterward and formed the subset used for the responsiveness analysis.
Demographic, clinical, and operative characteristics of the study cohort (n=160)
| Characteristic | Pre-operative (n =54) | Post-operative (n =106) | Total (n =160) |
|---|---|---|---|
| Age, years (mean±SD) | 57.1±8.9 | 59.3±8.3 | 58.6±8.5 |
| Sex, n (%) | |||
| Women | 31 (57.4) | 62 (58.5) | 93 (58.1) |
| Men | 23 (42.6) | 44 (41.5) | 67 (41.9) |
| Body mass index, kg/m (mean±SD) | 25.7±3.9 | 26.6±4.2 | 26.3±4.1 |
| Symptom duration, months (mean±SD) | 10.2±7.1 | 15.4±10.3 | 13.6±9.8 |
| Comorbidities, n (%) | |||
| Hypertension | 22 (40.7) | 52 (49.1) | 74 (46.3) |
| Type 2 diabetes mellitus | 15 (27.8) | 38 (35.8) | 53 (33.1) |
| Both hypertension and diabetes | 8 (14.8) | 22 (20.8) | 30 (18.8) |
| Diagnosis, n (%) | |||
| Central stenosis | 20 (37.0) | 34 (32.1) | 54 (33.8) |
| Foraminal/lateral recess stenosis | 15 (27.8) | 30 (28.3) | 45 (28.1) |
| Degenerative spondylolisthesis | 12 (22.2) | 26 (24.5) | 38 (23.8) |
| Mixed/other | 7 (13.0) | 16 (15.1) | 23 (14.4) |
| Schizas grade, n (%) | |||
| Mild-to-moderate (A/B) | 24 (44.4) | 37 (34.9) | 61 (38.1) |
| Severe (C/D) | 30 (55.6) | 69 (65.1) | 99 (61.9) |
| Educational status, n (%) | |||
| Primary education | 19 (35.2) | 39 (36.8) | 58 (36.3) |
| Secondary | 21 (38.9) | 40 (37.7) | 61 (38.1) |
| Higher/graduate | 14 (25.9) | 27 (25.5) | 41 (25.6) |
| Operation, n (%), post-operative subgroup only | NA | ||
| Decompression alone | NA | 41 (38.7) | 41 (38.7) |
| Decompression+fusion | NA | 65 (61.3) | 65 (61.3) |
| Levels operated, n (%), post-operative subgroup only | NA | ||
| One level | NA | 52 (49.1) | 52 (49.1) |
| Two levels | NA | 38 (35.8) | 38 (35.8) |
| Three levels | NA | 16 (15.1) | 16 (15.1) |
SD: Standard deviation, NA: Not applicable
Translation and cross-cultural adaptation
We followed the cross-cultural adaptation framework set out by Beaton et al. [13] to translate the English-language FLS-25 into Hindi, the same general approach used in earlier adaptations of this scale. Two bilingual, native Hindi-speaking translators worked independently and without knowledge of the questionnaire’s clinical purpose to produce separate forward translations, which a panel that included an orthopedic spine surgeon then merged into one version. A translator with no prior exposure to the original English instrument back-translated this harmonized version into English. An expert committee made up of orthopedic surgeons and linguists compared the original, the forward translations, and the back translation, resolving disagreements over meaning, idiom, and cultural fit to arrive at a pre-final Hindi draft. Fifteen Hindi-speaking patients with LSS, drawn from outside the main study sample, then piloted this draft so we could gauge how comprehensible, clear, and culturally acceptable it was; interviewers noted any item patients found confusing along with their suggested rewording. Because only minor wording changes emerged from this step, the expert committee reached consensus on the final H-FLS-25 without further revision.
Instruments
The H-FLS-25 comprises 25 items scored on a five-point Likert scale running from 0 (strongly disagree) to 4 (strongly agree); summed scores range from 0 to 100, with higher totals reflecting more severe symptoms and greater functional impairment. Alongside the H-FLS-25, participants filled out the already-validated Hindi ODI [14], a 10-domain measure of low back pain-related disability expressed as a percentage (0–100%), and a 10-cm VAS anchored at 0 (no pain) and 10 (worst imaginable pain) for both back and leg pain. The Hindi ODI was chosen as the principal external comparator because it is a validated Hindi-language measure of back-related disability and, to our knowledge, no validated Hindi disease-specific instrument for LSS existed against which the H-FLS-25 could be benchmarked.
Procedure
Baseline data collection took place at the outpatient clinic, where participants completed the H-FLS-25, Hindi ODI, and VAS. We re-administered the H-FLS-25 by telephone to a subset of patients roughly 2 weeks later to gauge test-retest reliability; a 2-week gap is standard in test-retest work on functional status questionnaires because it is long enough for patients to forget their earlier answers but short enough that their clinical status is unlikely to have genuinely changed [15]. Because baseline completion was self-administered whereas the retest was conducted by telephone, the retest also examined, incidentally, the stability of scores across two modes of administration. The 48 patients in the matched subgroup used for the responsiveness analysis were assessed once before surgery and again 3 months afterward; the treating surgeon chose decompression alone or decompression with instrumented fusion based on whether instability or spondylolisthesis was present.
Statistical analysis
We summarized demographic and clinical characteristics, including operative details such as surgery type and number of levels treated in the post-operative subgroup, using means, standard deviations (SD), and frequencies as appropriate. Cronbach’s alpha served as our measure of internal consistency for the total scale and each domain, treating values above 0.70 as acceptable, whereas test-retest reliability was captured through the intraclass correlation coefficient (ICC; two-way mixed-effects model, absolute agreement) and item-level agreement through weighted kappa statistics. To evaluate construct (convergent) validity, we computed Pearson correlations between H-FLS-25 total and domain scores on one hand and ODI and VAS scores on the other, treating coefficients of 0.40 or above as acceptable and taking higher values as evidence of stronger convergence. For known-groups validity, we compared H-FLS-25 scores between patients with mild-to-moderate stenosis (Schizas grade A/B) and those with severe stenosis (Schizas grade C/D) using independent-samples t-tests. We tabulated the mean, SD, and range for each of the 25 items along with floor and ceiling effects, defined as the proportion of participants scoring at the lowest or highest possible value for that item, and flagged any floor or ceiling effect exceeding 15% as notable. We explored the scale’s underlying factor structure through exploratory factor analysis with principal component extraction and varimax rotation, checking sampling adequacy with the Kaiser–Meyer–Olkin (KMO) measure and Bartlett’s test of sphericity, retaining factors with eigenvalues above 1, and treating item loadings of 0.40 or higher as meaningful. Within the matched pre-/post-operative subgroup, we quantified responsiveness to surgery using effect sizes, calculated as the mean score change divided by the pre-operative SD, with an effect size of 0.8 or above considered large. Measurement error was quantified using the standard error of measurement (SEM = SD × √[1−ICC]) and the smallest detectable change at the 95% confidence level (SDC95 = 1.96 × √2 × SEM) [16]. In the absence of an external anchor, a distribution-based minimal important change (MIC) was estimated as one half of the baseline SD [17] and examined against the magnitude of one SEM [18]. The SD used for these calculations was the pre-operative value in the matched surgical subgroup (Table 2), combined with the ICCs reported in Table 3. We took a two-sided P-value under 0.05 as statistically significant and carried out all analyses in the Statistical Package for the Social Sciences (IBM Corp., Armonk, NY, USA).
Responsiveness of the H-FLS-25, ODI, and VAS to surgical treatment (n=48)
| Variable | Pre-operative (n =48) | 3-month postoperative (n =48) | Effect size |
|---|---|---|---|
| H-FLS-25, Total | 68.4±13.1 | 33.7±10.4 | 2.65 |
| H-FLS-25, Physical pain | 13.9±3.1 | 9.1±2.6 | 1.55 |
| H-FLS-25, Activity limitation | 24.6±5.5 | 15.8±4.3 | 1.6 |
| H-FLS-25, Gait instability | 9.8±2.7 | 5.9±2.1 | 1.44 |
| H-FLS-25, Physical activity | 12.9±3.2 | 9.6±2.8 | 1.03 |
| H-FLS-25, Mental health | 7.5±1.8 | 4.8±1.4 | 1.5 |
| ODI score | 44.6±16.4 | 27.3±12.9 | 1.05 |
| VAS back pain | 5.6±2.0 | 3.4±2.1 | 1.1 |
| VAS leg pain | 6.8±2.4 | 2.9±2.0 | 1.63 |
Values are mean±standard deviation. Effect size was calculated as the mean change divided by the pre-operative standard deviation. H-FLS-25: Hindi version of the Fukushima Lumbar Spinal Stenosis Scale, ODI: Oswestry Disability Index, VAS: Visual Analog Scale
Internal consistency and test-retest reliability of the Hindi FLS-25 (H-FLS-25)
| H-FLS-25 domain | Cronbach’s alpha | ICC (95% CI) |
|---|---|---|
| Total score (25 items) | 0.89 | 0.92 (0.88–0.95) |
| Physical pain domain | 0.85 | 0.88 (0.82–0.92) |
| Activity limitation domain | 0.87 | 0.90 (0.85–0.93) |
| Gait instability domain | 0.81 | 0.85 (0.78–0.90) |
| Physical activity domain | 0.8 | 0.83 (0.75–0.88) |
| Mental/psychological health domain | 0.78 | 0.81 (0.72–0.87) |
ICC: Intraclass correlation coefficient, CI: Confidence interval, H-FLS-25: Hindi version of the Fukushima Lumbar Spinal Stenosis Scale
Sample size considerations
The adequacy of the sample was judged against accepted recommendations for psychometric research. For exploratory factor analysis, a minimum of five respondents per item and not fewer than 100 participants is widely advised [19], which corresponds to 125 participants for a 25-item instrument; the present sample of 160 yields 6.4 respondents per item. Samples of this order are, moreover, adequate when communalities are moderate to high, and the factors are well determined [20], a condition supported here by a KMO value above 0.80 and item loadings of 0.42 to 0.79. For test-retest reliability, at least 50 participants are recommended [21]; 142 patients completed the retest, nearly three times this threshold. The sample also exceeds those of the Iranian (n = 131) [9] and Korean (n = 129) [10] adaptations of the same instrument, and the responsiveness subgroup of 48 patients exceeds the 27 patients on whom responsiveness was assessed in the Korean adaptation [10]. We therefore regard the sample as more than adequate for the principal objectives of this study.
Results
We screened 178 patients, of whom 160 satisfied the eligibility criteria and completed baseline assessment; 142 went on to complete the 2-week retest for reliability analysis, and a matched subgroup of 48 completed assessments both before surgery and 3 months afterward for the responsiveness analysis. Table 1 summarizes the cohort’s demographic, clinical, and operative characteristics. Participants averaged 58.6 ± 8.5 years of age, and women made up 58.1% of the sample. As is typical among Indian patients with degenerative spinal disease, hypertension and type 2 diabetes mellitus were the leading comorbidities, and most patients (61.9%) presented with severe stenosis (Schizas Grade C or D). Within the 106-patient post-operative subgroup, decompression with instrumented fusion (61.3%) outnumbered decompression alone (38.7%), and single-level procedures (49.1%) were more common than two-level (35.8%) or three-level (15.1%) surgery, an operative pattern broadly similar to that reported in the Korean FLS-25 validation cohort [10].
Reliability
Internal consistency was high both for the total score and for each of the five domains that emerged from the factor analysis, with Cronbach’s alpha exceeding 0.80 for most domains and reaching 0.89 overall (Table 3). Test-retest reliability was likewise strong: the ICC for the total score topped 0.90, and domain-level ICCs fell in the good-to-excellent range. Weighted kappa values for individual items were mostly above 0.60, corresponding to substantial-to-almost-perfect agreement and indicating that responses to all 25 items held up well across the 2-week retest interval.
Construct and known-groups validity
The H-FLS-25 total score correlated strongly with both the ODI (r = 0.77) and VAS leg pain (r = 0.79), and moderately strongly with VAS back pain (r = 0.71), all significant at P < 0.001, supporting construct validity (Table 4). Domain-level correlations mirrored this pattern overall: the activity limitation and physical pain domains aligned most closely with disability and leg pain scores, while the mental/psychological health domain showed weaker, though still significant, associations. Patients with severe stenosis (Schizas grade C/D) scored significantly higher on the H-FLS-25 total than those with mild-to-moderate stenosis (Schizas grade A/B) (P < 0.001), confirming that the instrument can distinguish between these clinically distinct severity groups. The weaker association of the mental/psychological health domain with the ODI and VAS scores (r = 0.52–0.60) than that of the total score (r = 0.71 to 0.79) (Table 4) further indicates that the instrument is not merely a surrogate for pain or generic disability and offers preliminary indirect support for divergent construct behavior.
Correlation of the H-FLS-25 with the ODI and VAS scores (n=160)
| H-FLS-25 total | Physical pain | Activity limitation | Gait instability | Physical activity | Mental health | |
|---|---|---|---|---|---|---|
| ODI | 0.77* | 0.71* | 0.74* | 0.68* | 0.70* | 0.58* |
| VAS back pain | 0.71* | 0.69* | 0.65* | 0.60* | 0.63* | 0.52* |
| VAS leg pain | 0.79* | 0.75* | 0.77* | 0.70* | 0.72* | 0.60* |
Values are Pearson correlation coefficients.
*
P<0.001. H-FLS-25: Hindi version of the Fukushima Lumbar Spinal Stenosis Scale, ODI: OSWESTRY DISABILITY INDEX, VAS: Visual Analog Scale
Item-level score distribution
Table 5 reports the mean, SD, range, and floor/ceiling effects for all 25 items. Because no patient scored at either the minimum (0) or maximum (100) possible total, the H-FLS-25 covered a wide range of symptom severity without bunching at either end. Item 7 (“I can’t lie on my back”) showed a floor effect, suggesting it discriminates poorly among patients with mild or no difficulty in that position. Items 19 (“I often have no feeling in my legs”) and 20 (“If I walk for a while, my symptoms worsen and I can’t walk anymore”) both showed ceiling effects, implying these items may be less able to register further gains once walking tolerance and sensory symptoms have largely recovered.
Distribution of H-FLS-25 item scores (n=160)
| Item | Mean±SD | Range | Floor (%) | Ceiling (%) |
|---|---|---|---|---|
| Q1. Numbness/pain interferes with concentration | 2.3±0.5 | 1–4 | 0 | 12.5 |
| Q2. Leg cramps on lying down to sleep | 2.2±0.4 | 1–4 | 0 | 9.4 |
| Q3. Cannot walk unless bent forward | 1.4±0.4 | 0–4 | 1.9 | 0.6 |
| Q4. Feet feel cold while sleeping | 1.9±0.4 | 1–4 | 0 | 1.9 |
| Q5. Symptoms worsen on stretching back | 1.6±0.5 | 0–4 | 1.3 | 3.8 |
| Q6. Legs won’t move forward, nearly falls | 1.9±0.4 | 1–4 | 0 | 3.1 |
| Q7. Cannot lie on back | 1.0±0.5 | 0–3 | 15.6 | 0 |
| Q8. Spends most of day lying down | 1.5±0.5 | 0–4 | 2.5 | 1.3 |
| Q9. Cannot turn over in bed | 1.6±0.3 | 1–3 | 0 | 0 |
| Q10. Difficulty walking down stairs | 1.8±0.4 | 1–4 | 0 | 3.1 |
| Q11. Can only walk slowly | 2.0±0.5 | 1–4 | 0 | 4.4 |
| Q12. Cannot stand in one place for chores | 1.9±0.4 | 0–4 | 1.3 | 3.1 |
| Q13. Numbness/pain on prolonged standing | 1.8±0.4 | 0–4 | 0.6 | 0.6 |
| Q14. Can walk again after brief rest | 2.0±0.5 | 0–4 | 3.1 | 5 |
| Q15. Staggers on standing up or sitting down | 1.5±0.3 | 0–4 | 3.1 | 1.3 |
| Q16. Difficulty walking up stairs | 1.7±0.5 | 0–4 | 2.5 | 3.1 |
| Q17. Cannot stretch back | 1.3±0.5 | 0–4 | 3.8 | 1.3 |
| Q18. Symptoms worst on waking | 2.3±0.5 | 1–4 | 0 | 6.9 |
| Q19. No feeling in legs | 2.4±0.6 | 1–4 | 0 | 20.6 |
| Q20. Symptoms worsen with walking, cannot continue | 2.5±0.5 | 1–4 | 0 | 23.8 |
| Q21. Numbness/pain even while eating | 1.5±0.3 | 0–4 | 0.6 | 0.6 |
| Q22. Cannot walk due to exhaustion | 1.8±0.5 | 1–4 | 0 | 3.8 |
| Q23. Cannot twist body to look behind | 1.6±0.4 | 0–3 | 3.1 | 0 |
| Q24. Needs handrail on stairs | 1.7±0.4 | 0–4 | 0.6 | 1.9 |
| Q25. Effort required to sit up from Ivino | 1.4±0.3 | 0–3 | 4.1 | 0 |
Floor and ceiling effects denote the percentage of participants scoring the lowest and highest possible item value. SD: Standard deviation, H-FLS-25: Hindi version of the Fukushima Lumbar Spinal Stenosis Scale
Factor structure
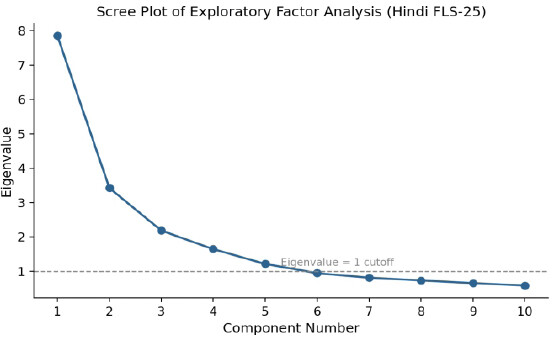
A KMO value above 0.80 together with a significant Bartlett’s test of sphericity (P < 0.001) confirmed that the data were suitable for factor analysis. Principal component analysis with varimax rotation yielded a five-factor solution, each factor with an eigenvalue above 1 (Fig. 1), which we labeled physical pain, activity limitation, gait instability, physical activity, and mental/psychological health. These five factors together explained roughly 66% of the total variance, and every item loaded at least 0.40 on its assigned factor, with loadings spanning about 0.42–0.79 (Table 6), which supports the structural validity of the H-FLS-25 in this population. As exploratory analysis is the accepted first step when an instrument is introduced into a new linguistic and cultural setting, as in the Korean adaptation [10], this structure should be regarded as provisional pending confirmatory factor analysis in an independent sample.
Five-factor structure of the H-FLS-25 identified by exploratory factor analysis (n=160)
| Factor (domain) | Representative items | Loading range |
|---|---|---|
| Physical pain | Items 2, 4, 5, 18, 19 (e.g., leg cramps at night, symptoms worse on waking) | 0.58–0.77 |
| Activity limitation | Items 3, 7, 9, 10, 12, 13, 16, 20 (e.g., difficulty with stairs, cannot stand in one place) | 0.49–0.79 |
| Gait instability | Items 6, 11, 15, 24 (e.g., staggers on standing, needs handrail on stairs) | 0.52–0.71 |
| Physical activity | Items 8, 14, 17, 22, 25 (e.g., spends most of day lying down, effort to sit up) | 0.44–0.68 |
| Mental/psychological health | Items 1, 21, 23 (e.g., difficulty concentrating, bothered while eating) | 0.42–0.65 |
H-FLS-25: Hindi version of the Fukushima Lumbar Spinal Stenosis Scale
Responsiveness to surgical treatment
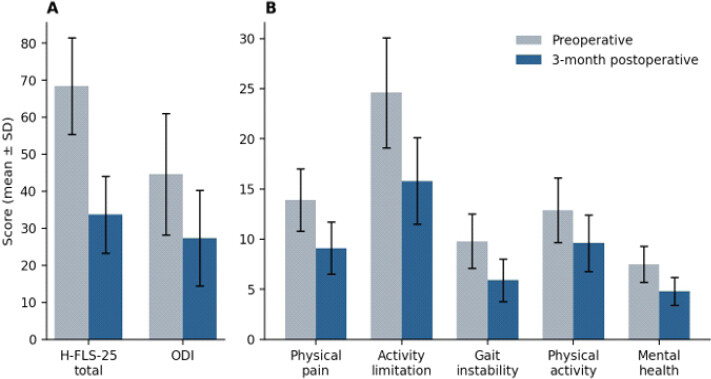
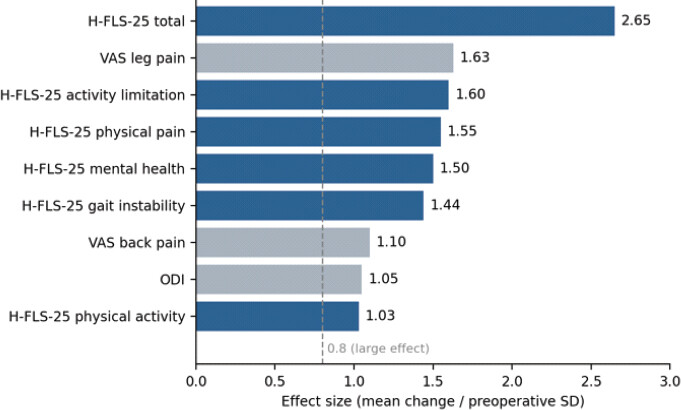
All 48 patients who completed both pre-operative and 3-month post-operative assessments showed significant gains across every H-FLS-25 domain as well as on the ODI and VAS (Table 2 and Fig. 2). The H-FLS-25 total score produced the largest effect size (2.65), ahead of the activity limitation (1.60) and physical pain (1.55) domains, with the physical activity domain trailing somewhat (1.03). Effect sizes for all measures are compared in Fig. 3. VAS leg pain showed a larger effect size (1.63) than either VAS back pain (1.10) or the ODI (1.05), hinting that the H-FLS-25 may be especially attuned to the leg-dominant symptom relief that typically follows surgical decompression.
Measurement error and interpretability
Table 7 presents the measurement error indices. The SEM of the H-FLS-25 total score was 3.7 points on the 0–100 scale, corresponding to a smallest detectable change of 10.3 points at the 95% confidence level. The mean improvement of 34.7 points in the surgical subgroup was more than 3 times this threshold. The distribution-based MIC, estimated at 6.6 points for the total score (one half of the baseline SD), lay well below the observed mean change, which was more than 5 times this value. Domain-level SEM values ranged from 0.8 to 1.7 points, and the observed mean changes exceeded the corresponding SDC95 for the physical pain, activity limitation, gait instability, and mental/psychological health domains, whereas that for the physical activity domain (3.3 points) approached but did not exceed its SDC95 (3.7 points), indicating that this domain is best interpreted at the group level. These MIC values should be regarded as provisional, because an anchor-based estimate was not available.
Measurement error and distribution-based minimal important change of the H-FLS-25 (n=48 surgical subgroup; ICCs from the test-retest sample)
| Measure | SEM (points) | SDC95 (points) | MIC, 0.5xSD (points) |
|---|---|---|---|
| H-FLS-25, Total | 3.7 | 10.3 | 6.6 |
| H-FLS-25, Physical pain | 1.1 | 3 | 1.6 |
| H-FLS-25, Activity limitation | 1.7 | 4.8 | 2.8 |
| H-FLS-25, Gait instability | 1 | 2.9 | 1.4 |
| H-FLS-25, Physical activity | 1.3 | 3.7 | 1.6 |
| H-FLS-25, Mental health | 0.8 | 2.2 | 0.9 |
SEM: Standard error of measurement (SD×√[1−ICC]), calculated from the pre-operative standard deviation of the matched surgical subgroup (Table 2) and the ICCs in Table 3; SDC95, smallest detectable change at the 95% confidence level (1.96×√2×SEM); MIC, distribution-based minimal important change (one half of the pre-operative standard deviation). These estimates are provisional pending anchor-based confirmation. MIC: Minimal important change, H-FLS-25: Hindi version of the Fukushima Lumbar Spinal Stenosis Scale
Discussion
This work describes translating, culturally adapting, and psychometrically validating the FLS-25 for Hindi-speaking Indian patients with LSS. The resulting H-FLS-25 achieved high internal consistency and excellent test-retest reliability, matching what has been reported for the original Japanese instrument and its Iranian and Korean adaptations [7,8,9,10]. That reliability held up across such different languages and health systems hints that the underlying symptom constructs – physical pain, activity limitation, and the psychological weight of neurogenic claudication – transfer reasonably well between cultures, even though each translation still demands its own careful linguistic and conceptual scrutiny.
The five-factor structure we found departs from the single-factor model reported in the original Japanese validation [6], though it aligns more closely with the four- and five-factor solutions described for the Korean and Chinese adaptations [10,11]. A few explanations seem plausible: our cohort skewed toward more severe stenosis and included a sizeable fusion-surgery subgroup, translation inevitably shifts item meaning slightly across languages, and patients from different cultural backgrounds may simply put neurogenic claudication into different words. The gait instability domain that emerged here may carry particular weight for Indian patients, given how routinely daily life involves stairs without railings, uneven walking surfaces, and floor seating.
The post-operative subgroup’s operative profile, with fusion outnumbering decompression alone and a sizeable share of multilevel surgery, is consistent with what one would expect at a tertiary spine referral center managing advanced degenerative disease and spondylolisthesis, and it resembles the operative mix seen in the Korean validation cohort [10]. Large effect sizes across H-FLS-25 domains after surgery, especially for leg-dominant symptoms in a mixed surgical cohort, indicate that the instrument captures meaningful clinical change and could be a useful companion to the ODI when tracking outcomes after surgery for LSS.
A validated, disease-specific tool such as the H-FLS-25 stands to offer real benefits over generic measures such as the ODI or VAS alone in Indian orthopedic practice, particularly for following how LSS symptoms evolve through conservative care or after decompression [3]. With India’s population aging and LSS increasingly recognized as a driver of mobility loss and dependency among older adults [2,3], a self-administered Hindi instrument could support both routine clinical assessment and future multicentric research into LSS treatment outcomes for the large share of the population that speaks Hindi.
Beyond the conventional psychometric properties, we have provided estimates of measurement error and interpretability. A total-score SEM of 3.7 points and an SDC95 of 10.3 points indicate that changes exceeding approximately 10 points on the 100-point scale can be distinguished from measurement noise at the level of the individual patient, whereas the distribution-based MIC of 6.6 points offers a provisional benchmark for group-level interpretation. These values are congruent in magnitude with the large mean improvement observed after surgery and give clinicians a practical reference when counseling and monitoring patients. Anchor-based estimation of the MIC, using a global rating of change, is a priority for subsequent work.
The principal strengths of this study are its large and heterogeneous source population, the consecutive enrollment of 160 patients, a sample that exceeds those of earlier adaptations of the scale [9,10], adherence to established guidelines for cross-cultural adaptation [13], and the concurrent examination of reliability, construct and known-groups validity, factor structure, responsiveness, and measurement error within a single cohort. The participating institute is among the largest in northern India and receives patients from approximately nine to ten states, which yields a clinically and socially diverse sample. The performance of the scale in a cohort in which 36.3% of participants had no more than primary-level education (Table 1), and in which severity, comorbidity, and pattern of stenosis varied widely, supports its robustness across the range of patients encountered in routine practice.
Several limitations merit consideration, and we have sought to address each of them. First, participants were recruited at a single institute. This institute, however, is among the largest tertiary referral institutes in northern India, with a catchment of approximately nine to ten states, and the cohort accordingly spanned a wide range of ages, comorbidities, educational backgrounds, and grades and patterns of stenosis (Table 1). The single-center design therefore constrains, but does not negate, generalizability, and confirmation in other regions and in primary and community settings remains desirable. Relatedly, consecutive enrollment at a referral center, where severe stenosis predominated, may over-represent advanced disease relative to the community; nonetheless, mild-to-moderate stenosis was well represented (38.1%), which permitted the known-groups comparison, and the scale is intended principally for patients who present to spine services. Second, no single institute can capture the full linguistic, cultural, and socioeconomic diversity of Hindi speakers across the country; yet the sample of 160 exceeded those of earlier adaptations of the scale [9,10] and met recommendations for every analysis undertaken, although it did not permit adequately powered analyses of small subgroups. Third, because the FLS-25 is a self-administered instrument, Hindi literacy was required, which excluded patients who could not read; for these patients an interviewer-administered or pictorial version would be needed. The telephone retest offers preliminary reassurance regarding stability across modes of administration, but formal equivalence testing of interviewer-administered, pictorial, and digital formats was not performed and warrants dedicated study.
With respect to responsiveness, the matched surgical subgroup comprised 48 patients assessed 3 months after surgery, a sample larger than the 27 patients on whom responsiveness was evaluated in the Korean adaptation [10] and sufficient to demonstrate large and consistent effects across every domain. The 3-month interval captures the early post-operative recovery that is most relevant to the use of the instrument in clinical practice and outcome registries, but it cannot speak to long-term sustained validity. The analysis was not stratified by procedure (decompression alone versus decompression with fusion) or by the number of levels operated, because the subgroup was too small for such comparisons to be adequately powered; the reported effect sizes should therefore be read as applicable to a mixed surgical population, and longer follow-up in larger, stratified cohorts is warranted. With respect to validity, the Hindi ODI served as the reference comparator because no validated Hindi disease-specific instrument for LSS was available, and comparison with other disease-specific measures will become feasible as Hindi versions emerge. Discriminant validity against an unrelated construct was not formally tested, although known-groups discrimination and the lower correlation of the mental/psychological domain with pain and disability scores provide supportive indirect evidence. Finally, the factor structure was derived by exploratory analysis and differs from that of the original instrument; it is consistent with the multi-factor solutions reported in the Korean and Chinese adaptations [10,11] but requires confirmatory factor analysis in an independent sample. Measurement error and the MIC were estimated here by distribution-based methods, and anchor-based confirmation of the MIC is likewise a priority.
Conclusion
In this cohort of Indian patients with LSS, the Hindi FLS-25 achieved high internal consistency, excellent test-retest reliability, and robust construct and known-groups validity, along with a five-factor structure broadly in line with other cross-cultural adaptations of the instrument and strong responsiveness to surgery, in a mixed surgical cohort, with measurement error and a provisional MIC quantified. Taken together, these results support the H-FLS-25 as a reliable, valid, and culturally appropriate disease-specific outcome measure for gauging symptom severity and functional limitation in Hindi-speaking patients with LSS, with a role to play in both routine clinical care and future outcomes research in India.
Clinical Message
Surgeons treating Hindi-speaking patients with LSS can now use a validated, disease-specific questionnaire in place of generic disability and pain scales alone. The Hindi Fukushima scale tracked symptom severity, distinguished mild-to-moderate from severe stenosis, and registered large improvement 3 months after surgery, supporting its use in routine outcome assessment and multicentric research.
Conflict of Interest:
Nil
Source of Support:
Nil
Consent:
The authors confirm that informed consent was obtained from the patient for publication of this article
How to Cite this Article
Raj S, Kumar V, Teja AT, Uppal R, Basil F, Goni VG. Cross-Cultural Adaptation and Validation of the Hindi Version of the Fukushima Lumbar Spinal Stenosis Scale-25 in Indian Patients with Lumbar Spinal Stenosis: A Cross-Sectional Psychometric Study. J Orthop Case Rep. 2026 November;16(11):504-513. doi: 10.13107/jocr.2026.v16.i11.8538.
References
- Jensen RK, Jensen TS, Koes B, Hartvigsen J. Prevalence of lumbar spinal stenosis in general and clinical populations: A systematic review and meta-analysis. Eur Spine J 2020;29:2143-63. [Google Scholar] | [PubMed]
- Mubarak M, Murugan C, Iyer RD, Pushpa BT, Shetty AP, Kanna RM. Congenital stenosis of the spine-a cross-sectional study of 1019 whole-spine computed tomography scans to determine prevalence and association among multilevel, tandem, and triple region stenosis. World Neurosurg 2024;183:e556-63. [Google Scholar] | [PubMed]
- Chhabra HS. Rising to the challenge: Spinal ailments in India. Indian J Orthop 2019;53:489-92. [Google Scholar] | [PubMed]
- Jeon CH, Kim DJ, Kim SK, Kim DJ, Lee HM, Park HJ. Validation in the cross-cultural adaptation of the korean version of the oswestry disability index. J Korean Med Sci 2006;21:1092-7. [Google Scholar] | [PubMed]
- Kim HJ, Lee YK, Kim DO, Chang BS, Lee CK, Yeom JS. Validation and cross-cultural adaptation of the korean version of the zurich claudication questionnaire in patients with lumbar spinal stenosis. Spine (Phila Pa 1976) 2018;43:E105-10. [Google Scholar] | [PubMed]
- Sekiguchi M, Wakita T, Fukuhara S, Otani K, Onishi Y, Kikuchi S. Development and validation of a quality of life scale specific for lumbar spinal stenosis. Spine (Phila Pa 1976) 2011;36:E1407-14. [Google Scholar] | [PubMed]
- Sekiguchi M, Wakita T, Otani K, Onishi Y, Fukuhara S, Kikuchi S. Development and validation of a symptom scale for lumbar spinal stenosis. Spine (Phila Pa 1976) 2012;37:232-9. [Google Scholar] | [PubMed]
- Sekiguchi M, Wakita T, Otani K, Onishi Y, Fukuhara S, Kikuchi S. Lumbar spinal stenosis-specific symptom scale: Validity and responsiveness. Spine (Phila Pa 1976) 2014;39:E1388-93. [Google Scholar] | [PubMed]
- Azimi P, Montazeri A. An Iranian version of the fukushima lumbar spinal stenosis scale (FLS-25): A validation study. Asian Spine J 2017;11:243-8. [Google Scholar] | [PubMed]
- Eun IS, Kim HS, Cho YJ, Goh TS, Lee JS. Cross-cultural validation of the Fukushima lumbar spinal stenosis scale in Korean patients with degenerative lumbar spinal stenosis. J Orthop Surg Res 2025;20:762. [Google Scholar] | [PubMed]
- Dong Y, Cao S, Zhou S, Hu F, Hu W, Qian D. Cross-cultural adaptation and validation of the simplified Chinese version of the Fukushima lumbar spinal stenosis scale. Eur Spine J 2025;34:815-23. [Google Scholar] | [PubMed]
- Schizas C, Theumann N, Burn A, Tansey R, Wardlaw D, Smith FW. Qualitative grading of severity of lumbar spinal stenosis based on the morphology of the dural sac on magnetic resonance images. Spine (Phila Pa 1976) 2010;35:1919-24. [Google Scholar] | [PubMed]
- Beaton DE, Bombardier C, Guillemin F, Ferraz MB. Guidelines for the process of cross-cultural adaptation of self-report measures. Spine (Phila Pa 1976) 2000;25:3186-91. [Google Scholar] | [PubMed]
- Sharma AK, Chaudhary K, Gandhi H, Nag A, Vatkar A, Nimesh R. Validity and reliability of Hindi version of oswestry disability index in Indian population. N Am Spine Soc J 2025;22:100593. [Google Scholar] | [PubMed]
- Tomkins-Lane CC, Battié MC. Validity and reproducibility of self-report measures of walking capacity in lumbar spinal stenosis. Spine (Phila Pa 1976) 2010;35:2097-102. [Google Scholar] | [PubMed]
- Weir JP. Quantifying test-retest reliability using the intraclass correlation coefficient and the SEM. J Strength Cond Res 2005;19:231-40. [Google Scholar] | [PubMed]
- Norman GR, Sloan JA, Wyrwich KW. Interpretation of changes in health-related quality of life: The remarkable universality of half a standard deviation. Med Care 2003;41:582-92. [Google Scholar] | [PubMed]
- Revicki D, Hays RD, Cella D, Sloan J. Recommended methods for determining responsiveness and minimally important differences for patient-reported outcomes. J Clin Epidemiol 2008;61:102-9. [Google Scholar] | [PubMed]
- Gorsuch RL. Factor Analysis. 2nd ed Hillsdale NJ. Lawrence Erlbaum Associates 1983. [Google Scholar] | [PubMed]
- MacCallum RC, Widaman KF, Zhang S, Hong S. Sample size in factor analysis. Psychol Methods 1999;4:84-99. [Google Scholar] | [PubMed]
- Terwee CB, Bot SD, De Boer MR, Van Der Windt DA, Knol DL, Dekker J. Quality criteria were proposed for measurement properties of health status questionnaires. J Clin Epidemiol 2007;60:34-42. [Google Scholar] | [PubMed]
© 2026 Journal of Orthopaedic Case Reports - Published by Indian Orthopaedic Research Group
About the Authors
-

Sharath Raj
-

Vishal Kumar
-

Aduri Tharun Teja
-

Rahul Uppal
-

F Basil
-

Vijay G Goni
Related Articles in Journal of Orthopaedic Case Reports
 November 1, 2026 Validity and Reliability of the Hindi Versions of the Lysholm Knee Scoring Scale and Tegner Activity Scale
 November 1, 2026 Utilization of Ayushman Bharat Pradhan Mantri Jan Arogya Yojana for Total Hip Replacement at a Tertiary Care Center in North India: A Retrospective Analysis
 October 1, 2026 Arthrokinematic and Magnetic Resonance Imaging-Based Outcomes of Customized Lateral Wedge Insoles in Medial Compartment Knee Osteoarthritis: Six-Month Interim Findings of a Prospective Cohort Study
 October 1, 2026 Morphometric Variants of the Coccyx in an Eastern Indian Cohort: Analysis from a Tertiary Care Center