
Accessible pre-screening with QUS and the FRAX tool offers a practical and cost-effective method for the early detection of osteoporosis in resource-limited settings, enabling timely intervention among high-risk populations.
Dr. Vineet Thomas Abraham, Department of Orthopaedics, All India Institute of Medical Sciences, Mangalagiri, Andhra Pradesh, India. E-mail: abrahamvineet@hotmail.com
Abstract
Introduction: To investigate the prevalence of osteoporosis and its association with age, sex, body mass index (BMI), and bone mineral density (BMD) in a sample of individuals from South India. To assess the risk of major osteoporotic fractures (MOF) and hip fractures among study participants.
Materials and Methods: This cross-sectional study was conducted in a tertiary care hospital in Southern India. A sample of 453 participants, both male and female, above 50 years of age was included. BMD measurements were assessed using the ultrasound bone densitometer. The BMI and fracture risk assessment (FRAX) score were calculated for all patients.
Results: The average age of the participants was 60 years. The mean t-score was −1.57. 306 (68%) had osteopenia, and 45 (9.9%) participants had osteoporosis. A higher number of females (73%) had osteoporosis than males (27%). There was no significant difference between the BMI in the normal (28.16) and the osteopenia (27.67) and osteoporotic groups (26.92). Mean MOF risk was 4.03 (2.81 SD).
Conclusion: Decrease in BMD was associated with increased fracture risk, particularly among older female participants. The findings underscore the need for targeted public health interventions and clinical strategies to improve bone health and reduce fracture risk.
Keywords: Prevalence, bone mineral density, body mass index, fracture risk assessment score, osteoporosis.
Osteoporosis is a metabolic bone disease that is marked by a low bone mass and deterioration of bone microarchitecture, which increases bone fragility and susceptibility to fractures (World Health Organization, 1994) [1]. In 2006, osteoporosis was estimated to have caused more than 89 lakh fractures annually worldwide, resulting in an osteoporotic fracture occurring every 3 s [2]. As per the report of the International Osteoporosis Foundation, osteoporosis-related fractures affect about 1 in 3 women and 1 in 5 men aged 50 years or above during their lifetime [3]. The significant risk factors include age of the individual, gender, body mass index (BMI), and bone mineral density (BMD) [4,5]. In South Asia, the burden of non-communicable diseases is rising, and there is a need to understand the epidemiology of osteoporosis [6,7]. Early diagnosis by BMD assessment and the prediction of fracture risk are important because they can decrease morbidity and can significantly reduce the burden on the Indian health care system. A study conducted in the urban population of New Delhi, utilising quantitative ultrasound (QUS) for BMD assessment, reported the prevalence of osteoporosis to be 8.9% and that of osteopenia to be 59.55%. They also found that 20 (0.04%) individuals had a significant osteoporotic fracture risk exceeding 20% [8]. A cross-sectional study in southern India in patients above 50 years of age reported a high prevalence of osteoporosis (50%) and osteopenia (36%) [9]. There is a need to investigate further and fully characterise the prevalence and risk factors of osteoporosis within diverse populations in South India. These studies’ findings unveil the regional variations and further accentuate the importance of more focused research to address the specific needs. Yen et al. conducted a study comparing QUS to DXA for pre-screening of osteoporosis. They found a meaningful correlation between QUS and DXA and concluded that pre-screening for osteoporosis with calcaneus QUS is useful [10]. Through this study, we investigated the prevalence of osteoporosis and its association with age, sex, BMI, and BMD in a specific sample of individuals from South India. In addition, we assessed the risk of major osteoporotic fractures (MOF) and hip fractures (HF) among study participants using the fracture risk assessment (FRAX) tool.
This study was a cross-sectional design, conducted at a tertiary care hospital in Southern India, including 453 men and women aged above 50 years who presented to the orthopaedic department. Female patients on hormonal replacement therapy, post-hysterectomy patients, patients on corticosteroid therapy, bedridden patients, and immunocompromised patients were excluded from the study. Ethics approval was obtained from the AIIMS Mangalagiri Institutional Ethics Committee. The approval number is AIIMS/MG/IEC/2022–23/182. Participants’ demographic information, including age, sex, height, weight, and place of residence (rural or metropolitan), was collected. For each participant, the BMI was calculated using an established formula and was categorised according to the South Asian BMI guidelines [11]. BMD measurements were assessed using the ultrasound bone densitometer (Furuno CM-300). The QUS measurements were done at the level of the mid-calcaneum. Quality assurance tests and calibration for the machine were performed by a single trained technician on each screening day. The overall median t-score was calculated, and participants were classified into 3 categories: normal bone density, osteopenia, and osteoporosis, based on the established diagnostic criteria [1,12]. A well-validated risk assessment tool, namely FRAX®, was used to estimate each participant’s risk of MOF and HF [1]. Participants showing a significant osteoporotic fracture risk of ≥20% or an HF risk of ≥3% were considered for the treatment [8]. The patients were then informed and explained about their BMI, BMD score, and the fracture risk, and appropriate advice and treatment were given to the patients by the treating doctor. The statistical analysis was performed, including the correlation, chi-square, analysis of variance, and regression analyses to examine the significant associations between bone health, fracture risk, age, sex, BMI, and BMD. The data collection procedure followed high-quality clinical protocols and adhered to the data privacy policies. Statistical analyses were conducted to examine the relationship between the participants’ bone health status, fracture risk, age, sex, BMI, and BMD.
453 participants were examined to determine the prevalence of osteoporosis and its relationship with age, sex, residence, BMI, and BMD. The majority of the participants, 49%, were in the 50–59 age range (Table 1). The average age of the participants was 60 years (interquartile range [IQR], 55–65 years). The study included 226 females (49.9%) and 227 males (50.1%). The median height was 156 cm (IQR: 149–163), and the median total weight was 67 kg (IQR: 58–76). As per BMI categories for South Asians, the data showed that 71% of the participants were obese, 13% were overweight, and only 14% were normal weight (Table 1). The overall median t-score was −1.67 (IQR: −2.11 to −1.09). The mean t-score was −1.57 (Table 2). 306 (68%) participants were classified as having osteopenia. 45 (9.9%) participants had osteoporosis (Table 1). The median age of participants with osteopenia was 60 years (IQR: 55–66), those with osteoporosis were 65 years (IQR: 60–70), and those with normal bone density were 58 years (IQR: 54–62), and this was significant (P < 0.001) (Table 2). Of the total 161 participants (36%) in the 60–69 age group, 29 (18%) were in the normal group, 110 (68.3%) had osteopenia, and 22 (13.6%) had osteoporosis. A higher number of females (73%) had osteoporosis than males (27%). A higher number of males (64%) had a normal BMD than females (36%) (P < 0.001) (Table 2). 51% of participants were from rural areas and 49% were from metropolitan areas. There was no significant difference with regard to osteoporosis among the rural (53%) and urban (47%) participants in our study (P = 0.4) (Table 2). From our study, we found that the average BMI was 27.71. There was no significant difference between the BMI in the normal (28.16) and the osteopenia (27.67) and osteoporotic groups (26.92), and the P = 0.405. In the age group of 70 years and above, there were 7 (9.7%), 52 (72.2%), and 13 (18.1%) participants who were normal, had osteopenia, and had osteoporosis, respectively (Table 3). Among the obese, 78 (24.37) were normal, 215 (67.18) had osteopenia, and 27 (8.43%) had osteoporosis. In the overweight individuals, 10 (16.95%) were normal, 43 (72.8%) had osteopenia, and 6 (10.16%) had osteoporosis. Among the individuals with normal BMI, 13 (21%) were normal, 41 (66%) had osteopenia, and 8 (13%) had osteoporosis. In the underweight BMI, 7 (58%) had osteopenia and 4 (33%) had osteoporosis. The percentage of participants who were normal or underweight had a higher incidence of osteoporosis. The average t-score was the lowest in the underweight group (−2.04) and was highest in the obese group (−1.52). This difference was significant, P = 0.049 (Table 3). Significant differences were observed in the risk of MOF across the groups (P < 0.001). The mean MOF risk was 4.03 (2.81 SD). Individuals with osteopenia or osteoporosis had mean risks of 3.97 (2.06 SD) and 8.76 (4.14 SD), respectively, whereas participants with normal bone health had a significantly reduced risk, at 2.14 (1.2 SD). The risk increased by almost 4 times when comparing patients with normal bone health to patients with osteoporosis. This difference was significant (P < 0.001) (Table 2). Similarly, there was a significant difference (P < 0.001) in the risk of HF among the groups. The normal group had the lowest risk, at 0.31 (0.35 SD), while the overall mean HF risk was 1.25 (1.27 SD). The risk categories for osteoporosis and osteopenia had mean values of 3.83 (1.7 SD) and 1.19 (0.82 SD), respectively. Both MOF risk and HF risk were higher in the underweight group, 5.03 and 2.015 compared to the overweight group, 3.96 and 1.16, respectively, and this was significant (P = 0.02 and 0.005) (Table 3). The mean t-score among the obese was −1.52 and among the underweight was −2.04, showing a decreasing trend of BMD with weight, and the association was significant (P = 0.05) (Table 3). Fig. 1 depicts the negative correlation (r = −0.74) between age and bone t-score. Notably, with correlation values of −0.97 and −0.98, respectively, bone t-score showed a very substantial negative connection with both MOF risk and HF risk. Age correlated negatively with weight (r = −0.76) as well, which gave a negative correlation between weight and BMI (r = −0.66). As the age increased, there was a significant increase (r = 0.82) in both MOF risk and HF risk. As demonstrated in the multivariable scatter plot (Fig. 2), MOF risk exhibited an inverse relationship with t-score, which was negatively correlated with increasing age and was more pronounced among female subjects. Younger individuals seemed to gravitate lower in terms of MOF risk, as evidenced by the smaller circles at the bottom of the plot. The T-score was much lower in females, and with increasing age, also the MOF was higher in females with increasing age. The distribution of t-scores for the four BMI categories – underweight, normal, overweight, and obese – is shown in Fig. 2, classified into normal, osteopenic and osteoporotic groups. The data indicate a discernible pattern of declining osteoporotic t-score prevalence with rising BMI. There are almost no individuals in the underweight category who have normal BMD, even though the number of participants is quite low in this category (Fig. 3).
The study’s findings emphasise the importance of awareness, screening, and early intervention to prevent osteopenia and osteoporosis in this population, with significant implications for clinical practice and public health. The identification of age, gender, and BMI as significant risk factors amplifies the need for the development of targeted prevention and management programmes tailored to the specific needs of different demographic groups [13,14,15,16]. Furthermore, the strong association between bone density and fracture risk emphasises the importance of incorporating FRAX into the clinical evaluation of patients, particularly those with known risk factors [17]. These facts influence the need for timely interventions, such as lifestyle modifications, pharmacological treatments, and fall prevention strategies, to reduce the burden of osteoporosis-related fractures in this population [18,19]. This cross-sectional study provides valuable insights into the epidemiology of osteoporosis and its associated risk factors in a sample of individuals in South India. The prevalence of osteoporosis in our study was found to be 9.93%, which was similar to a study conducted by Vaishya et al. in New Delhi, which showed a prevalence of 8.99% [8]. In a large population-based study of perimenopausal women, the prevalence of osteopenia and osteoporosis was 27.3% and 4.1%, respectively [13]. Agrawal and Sharma reported the prevalence of osteoporosis as 8.5% in Indian men above 50 years [20]. In our study, the prevalence of osteoporosis in men was 5.28% and in females, 14.6%.
Age and bone health:
In our study, the mean age of the study population was 60.58 years. The results showed a clear association between age and bone health. Older participants, particularly those in the 60–69 and 70+ age groups, had a higher prevalence of osteopenia and osteoporosis, 13.66% and 18.05%, respectively. Kaushal et al. found the prevalence of osteoporosis in age groups 50–59 years, 60–69 years, and ≥70 years to be 14.3%, 18.6%, and 36.4%, respectively, among females, and 6.5%, 4.3%, and 5.6%, respectively, among males [21].
Sex difference:
The proportion of females was higher in the osteoporosis group than in the male group, while the proportion of males was higher in the normal bone density group. Women generally have a higher prevalence of osteoporosis and a lower BMD than men because of the role of hormonal changes and other sex-specific factors in the pathogenesis of this condition. De Martinis et al. reported that out of 2,376 subjects screened for osteoporosis, 94.5% were women and only 5.4% were men. Women exhibited lower BMD compared to men (t-score values: −2.33 ± 1.14 vs. −1.31 ± 1.55; P < 0.001) [22]. Sharma et al. found that the maximum number of both osteoporotic and osteopenic women was recorded in the age group of 55–64 years and observed that almost all women (100%) over 65 years of age had either of these conditions [23]. In our study, the prevalence in participants aged 70 years and above was found to be approximately 3 times higher in females (10, 76.9%) than in males (3, 23.1%). In a study conducted among the South Indian population by Chitten and James, the overall prevalence of osteopenia and osteoporosis was found to be 48.4% and 6.6%, respectively, in all the age groups [24]. BMI and bone health: Data revealed a complex relationship between BMI and bone health. While obesity was highly prevalent in the study population, obese participants had a lower median t-score than the underweight group. This inverse association between BMI and BMD has been reported in other studies. It may be attributed to factors such as the mechanical loading effects of excess weight, as well as the potential influence of adipokines and other metabolic factors on bone metabolism. The link between BMI and bone health is heterogeneous, yielding inconsistent results. While some studies suggest that obesity may be protective against osteoporosis, longitudinal data paint a different picture. A cross-sectional study had found that 37% of overweight and obese patients had significantly lower lumbar BMD than expected, with obesity (BMI >30) associated with low bone mass compatible with osteoporosis [25]. Studies found that obese older adults experienced greater loss of bone density in the femoral neck over time compared to those with normal weight, contradicting the idea that obesity protects bones [26]. A systematic review by Turcotte et al. of 121 studies found that obesity is associated with higher bone mass and favourable bone structure, with bone turnover rates being lower or similar to those without obesity [27]. Reports are suggestive that obesity was associated with reduced HF in men and postmenopausal women and reduced wrist fractures in postmenopausal women but increased ankle fractures in postmenopausal women [19]. In our study, the majority of our participants belonged to the obese category, 320 (70.6%). The mean BMI was 27.71 kg/m2. In our study, osteoporosis was maximum in the underweight, 33.3%, followed by normal, 12.9%, and overweight, 10.2%. It was lowest in the obese (8.43%). Kumar et al. found a positive association between BMI and BMD among females [28]. They evaluated 255 healthy pre- and postmenopausal females. They found that with the increase in BMI, the BMD values also increased in premenopausal females, but the association was lost in postmenopausal females. Karunanayake et al. also found that low BMI (odds ratio 3.1) was positively associated with osteoporosis incidence [29].
Urban and rural population:
When comparing the prevalence of osteoporosis among the urban and rural populations, we found no significant difference. The mean t-score among females living in rural areas was found to be −1.72 SD, and it was −1.54 SD among males, and the overall mean t-score was −1.63 SD. Similarly, among the urban population, it was found to be −1.72 SD among females, −1.31 SD among males, and the overall mean t-score was −1.50 SD. 80.17% of the rural population had either osteopenia or osteoporosis compared to 74.66% seen in the urban population. Matsuzaki et al., in their meta-analysis, found opposing evidence on urban-rural BMD differences, with high-income countries showing higher BMD in rural areas. At the same time, findings were inconsistent in low- and middle-income countries [30]. Zheng et al. concluded from their study that the prevalence of osteoporosis in rural populations was higher than that in urban populations, and the factors associated with the risk of osteoporosis were similar in urban and rural populations [31]. Raj et al., in their study, concluded that females, the elderly, and urban residents have an increased chance of low BMD [32]. Overall, on studying the literature, we found that there is no clear difference in BMD between rural and urban populations.
Fracture risk:
The study found a strong negative correlation between the bone t-score and the risk of MOF and HF. Individuals with lower bone density had a notably higher fracture risk, which emphasises the need for early identification and treatment. Multiple studies confirmed that lower BMD correlates with increased fracture risk [33,34,35,36]. In the study done by Vaishya et al., of the 445 participants, the number of individuals with >20% MOF risk was 20 (0.04%), and the number of individuals with HF risk >3% was 93 (20.89%) [8]. The limitations of this study must be acknowledged. Primarily, the cross-sectional design limits the ability to establish definitive causal relationships between BMD, BMI, and fracture risk, and the lack of longitudinal follow-up prevents the assessment of actual long-term fracture outcomes. Furthermore, as a single-centre, hospital-based study, the sample may not fully represent the general population, inherently introducing selection bias and limiting generalisability to broader regions. Our strict exclusion criteria, while necessary for controlling variables, excluded key demographic groups (such as patients on corticosteroid or hormone replacement therapies), which may restrict the applicability of these findings to real-world clinical populations. The sample size was also relatively small for specific subgroup analyses, notably within the underweight cohort, which reduces statistical power for those specific groups. Methodologically, while quantitative ultrasonography (QUS) is accessible for pre-screening, the use of QUS instead of the gold-standard DEXA scan may reduce overall diagnostic accuracy. In addition, QUS measurements were restricted to the calcaneum and may not accurately reflect axial skeletal BMD (such as the hip or spine), which are the most clinically relevant sites for MOF. Relying on the FRAX tool without direct DEXA inputs also carries the limitation of potentially underestimating or overestimating fracture risk. We must also consider that self-reported variables utilised in the FRAX calculation (e.g., prior fractures, smoking, alcohol use) are inherently subject to recall bias. Possible inter-observer or device variability, despite daily calibration, could still influence QUS measurements. Furthermore, our analysis did not evaluate important potential confounders such as dietary calcium intake, vitamin D status, sunlight exposure, physical activity levels, or fall risk factors, all of which are critical determinants of fracture risk. Comorbidities known to influence bone health, including diabetes and thyroid disorders, were also not factored into the final analysis. Finally, the high prevalence of obesity within our specific study population may skew the observed associations between BMI and BMD.
This study highlights the significant burden of osteoporosis and its associated risk factors in the South Indian population, emphasizing the importance of increasing awareness and implementing targeted preventive measures. Reduced BMD was strongly associated with a higher risk of fractures, particularly among older female participants. No significant differences were observed in the prevalence of osteopenia and osteoporosis between urban and rural populations. These findings underscore the need for focused public health initiatives, early screening programs, and effective clinical management strategies to improve bone health, reduce fracture incidence, and enhance the quality of life of individuals at risk of osteoporosis in this region.
Routine bone health screening using accessible tools such as QUS and the FRAX is strongly recommended for individuals aged 50 years and above, particularly females and those with a low BMI. Reduced BMD is significantly associated with an increased risk of major osteoporotic and HF, making early detection essential. Proactive screening facilitates the timely implementation of appropriate pharmacological interventions, lifestyle modifications, and fall-prevention strategies, thereby reducing fracture risk, minimizing associated morbidity, and improving overall quality of life.
References
- 1. NIH Consensus Development Panel on Osteoporosis Prevention, Diagnosis, and Therapy. Osteoporosis prevention, diagnosis, and therapy. JAMA 2001;285:785-95. [Google Scholar] [PubMed]
- 2. Johnell O, Kanis JA. An estimate of the worldwide prevalence and disability associated with osteoporotic fractures. Osteoporos Int 2006;17:1726-33. [Google Scholar] [PubMed]
- 3. Sozen T, Ozisik L, Calik Basaran N. An overview and management of osteoporosis. Eur J Rheumatol 2017;4:46-56. [Google Scholar] [PubMed]
- 4. Morin S, Tsang JF, Leslie WD. Weight and body mass index predict bone mineral density and fractures in women aged 40 to 59 years. Osteoporos Int 2008;20:363-70. [Google Scholar] [PubMed]
- 5. Asomaning K, Hooven F, Pekow PS, Nasca PC, Bertone-Johnson ER. The association between body mass index and osteoporosis in patients referred for a bone mineral density examination. J Women’s Health (Larchmt) 2006;15:1028-34. [Google Scholar] [PubMed]
- 6. Xiao PL, Liu D, Hsu CJ, Lu HD, Cui AY, Ma YG, et al. Global, regional prevalence, and risk factors of osteoporosis according to the World Health Organization diagnostic criteria: A systematic review and meta-analysis. Osteoporos Int 2022;33:2137-53. [Google Scholar] [PubMed]
- 7. Siegel KR, Ali MK, Patel SA. Non-communicable diseases in South Asia: Contemporary perspectives. Br Med Bull 2014;111:31-44. [Google Scholar] [PubMed]
- 8. Vaishya R, Vijay V, Agarwal AK, Maheshwari P. Assessment of osteoporotic fracture risk in Urban Indian population using quantitative ultrasonography & FRAX tool. Indian J Med Res 2017;146:S51-6. [Google Scholar] [PubMed]
- 9. Hemalata D. The prevalence of osteoporosis and osteopenia in persons above 50 years attending a tertiary care hospital in South India. J Med Sci Clin Res 2016;4:14458-62. [Google Scholar] [PubMed]
- 10. Yen CC, Lin WC, Wang TH, Chen GF, Chou DY, Lin DM, et al. Pre-screening for osteoporosis with calcaneus quantitative ultrasound and dual-energy X-ray absorptiometry bone density. Sci Rep 2021;11:15709. [Google Scholar] [PubMed]
- 11. Verma M, Kishore K, Rajput M, Kathirvel S. Asian BMI criteria are better than WHO criteria in predicting Hypertension: A cross-sectional study from rural India. J Family Med Prim Care 2019;8:2095-100. [Google Scholar] [PubMed]
- 12. Gopinathan NR, Sen RK, Behera P, Aggarwal S, Khandelwal N, Sen M. Awareness of osteoporosis in postmenopausal Indian women: An evaluation of osteoporosis health belief scale. J Midlife Health 2016;7:180-4. [Google Scholar] [PubMed]
- 13. Smeets-Goevaers CG, Weerdenburg JP, Pols HA, Beijers LM, Lesusink GL, Pop VJ, et al. The prevalence of low bone mineral density in Dutch perimenopausal women: The eindhoven perimenopausal osteoporosis study. Osteoporos Int 1998;8:404-9. [Google Scholar] [PubMed]
- 14. Sadat-Ali M, Azam MQ, Al-Turki HA, Al-Habdan IM. An epidemiological analysis of the incidence of osteoporosis and osteoporosis-related fractures among the Saudi Arabian population. Ann Saudi Med 2012;32:637-41. [Google Scholar] [PubMed]
- 15. Qadan L, Ahmed A. Addressing gaps in osteoporosis screening in Kuwait using opportunistic quantitative computer tomography (QCT): A retrospective study. Arch Osteoporos 2023;18:50. [Google Scholar] [PubMed]
- 16. Cavalli L, Cavalli T, Black DM, Cianferotti L, Fossi C, Metozzi A, et al. Prevalence of osteoporosis in the Italian population and main risk factors: Results of BoneTour Campaign. BMC Musculoskelet Disord 2016;17:396. [Google Scholar] [PubMed]
- 17. Leslie WD, Morin SN. New developments in fracture risk assessment for current osteoporosis reports. Curr Osteoporos Rep 2020;18:115-29. [Google Scholar] [PubMed]
- 18. Siris ES, Chen YT, Abbott TA, Barrett-Connor E, Miller PD, Wehren LE, et al. Bone mineral density thresholds for pharmacological intervention to prevent fractures. Arch Intern Med 2004;164:1108-12. [Google Scholar] [PubMed]
- 19. Arceo-Mendoza RM, Camacho PM. Postmenopausal osteoporosis: Latest guidelines. Endocrinol Metab Clin North Am 2021;50:167-78. [Google Scholar] [PubMed]
- 20. Agrawal NK, Sharma B. Prevalence of osteoporosis in otherwise healthy Indian males aged 50 years and above. Arch Osteoporos 2013;8:116. [Google Scholar] [PubMed]
- 21. Kaushal N, Vohora D, Jalali RK, Jha S. Prevalence of osteoporosis and osteopenia in an apparently healthy Indian population – a cross-sectional retrospective study. Osteoporos Sarcopenia 2018;4:53-60. [Google Scholar] [PubMed]
- 22. De Martinis M, Sirufo MM, Ginaldi L, Polsinelli M, Di Silvestre D, Placidi G. Gender differences in osteoporosis: A single-center observational study. World J Men’s Health 2020;39:750. [Google Scholar] [PubMed]
- 23. Sharma S, Tandon VR, Mahajan A, Kour A, Kumar D. Preliminary screening of osteoporosis and osteopenia in Urban women from Jammu using calcaneal QUS. Indian J Med Sci 2006;60:183-9. [Google Scholar] [PubMed]
- 24. Chitten JJ, James B. Prevalence of osteopenia and osteoporosis in orthopaedic outpatients in Southern India. J Clin Diagn Res 2018;12:14-7. [Google Scholar] [PubMed]
- 25. Greco EA, Santiemma V, Rossi F, Lenzi A, Annoscia C, Spera G, et al. Is obesity protective for osteoporosis? Evaluation of bone mineral density in individuals with high body mass index. Int J Clin Pract 2020;64:817-20. [Google Scholar] [PubMed]
- 26. Lloyd JT, Orwig D, Womack C, Waldstein SR, Harris TB, Kritchevsky SB, et al. Changes in bone mineral density over time by body mass index in the health ABC study. Osteoporos Int 2016;27:2109-16. [Google Scholar] [PubMed]
- 27. Turcotte AF, O’Connor S, Morin SN, Gibbs JC, Willie BM, Jean S, et al. Association between obesity and risk of fracture, bone mineral density and bone quality in adults: A systematic review and meta-analysis. PLoS One 2021;16:e0252487. [Google Scholar] [PubMed]
- 28. Kumar A, Sharma AK, Mittal S, Kumar G. The relationship between body mass index and bone mineral density in premenopausal and postmenopausal North Indian women. J Obstet Gynaecol India 2016;66:52-6. [Google Scholar] [PubMed]
- 29. Karunanayake AL, Pinidiyapathirage MJ, Wickremasinghe AR. Prevalence and predictors of osteoporosis in an urban Sri Lankan population. Int J Rheum Dis 2010;13:385-90. [Google Scholar] [PubMed]
- 30. Matsuzaki M, Pant R, Kulkarni B, Kinra S. Comparison of bone mineral density between Urban and rural areas: Systematic review and meta-analysis. PLoS One 2015;10:e0132239. [Google Scholar] [PubMed]
- 31. Zheng M, Wan Y, Liu G, Gao Y, Pan X, You W, et al. Differences in the prevalence and risk factors of osteoporosis in Chinese Urban and rural regions: A cross-sectional study. BMC Musculoskelet Disord 2023;24:46. [Google Scholar] [PubMed]
- 32. Raj V, Barik S, Raj M. Attention to the bone health of a neglected rural-tribal population in India: A pilot study. Indian J Community Med 2023;48:501-4. [Google Scholar] [PubMed]
- 33. Cranney A, Tsang JF, Jamal SA, Josse RG, Leslie WD. Low bone mineral density and fracture burden in postmenopausal women. CMAJ 2007;177:575-80. [Google Scholar] [PubMed]
- 34. Goel H, Hans D, Binkley N, Leslie WD. Fracture risk gradient assessed by categories of bone mineral density and trabecular bone score: The Manitoba BMD registry. Arch Osteoporos 2023;18:73. [Google Scholar] [PubMed]
- 35. Hillier TA, Rizzo JH, Pedula KL, Ensrud KE, Bauer DC, Lui L, et al. WHO absolute fracture risk models (FRAX): Do clinical risk factors improve fracture prediction in older women without osteoporosis? J Bone Mineral Res 2011;26:1774-82. [Google Scholar] [PubMed]
- 36. Sosa DD, Eriksen EF. Reduced bone material strength is associated with increased risk and severity of osteoporotic fractures. An impact microindentation study. Calcif Tissue Int 2017;101:34-42. [Google Scholar] [PubMed]


Related Articles in Journal of Orthopaedic Case Reports
 June 1, 2026 Reliability of Singh’s Index and Calcaneal Index in Assessing Osteoporosis Compared with Quantitative Ultrasound Bone Mineral Density
 March 1, 2026 Risk Factors for Osteoporotic Vertebral Fractures in Postmenopausal Women: A Cross-Sectional Study
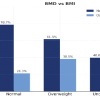 February 1, 2026 Assessment of Bone Mineral Density and Its Correlation with Body Mass Index and Stress Fractures among Paramilitary Recruits
 July 1, 2026 Aseptic Discitis with Instability after Posterior Spine Surgery